- 14 Projects
- 14 Posts
- 9 Live demos
- ~20 Agent workers
The Notebook
Recent writing
-
Trust is a property of the system, not the agent
agents
A near-miss with a git flag once put three volumes of real data one sync cycle from deletion — caught by luck, not by design. The right fix wasn't more vigilance. It was building the trust into the system itself: an agent doesn't need to be trusted, an action needs to be cheap to undo.
-
What breaks when you run twenty agents at once
agents
A failure taxonomy from a year of running coding-agent fleets unattended. Eight ways a fleet dies, none of which involve the model — and the operational discipline they add up to.
-
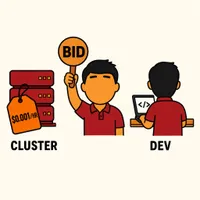
Rackspace Spot from zero: a spot-priced Kubernetes cluster with a DevPod dev environment
kubernetes Last verified ·
Onboard to Rackspace Spot's auction-priced Kubernetes, dodge the four traps every new cloudspace hits, and stand up a devcontainer-based dev environment with DevPod — for as little as $0.001/hr.

The Constellation
The Arcade
Live demos
- Adaptive Auto-Battler — PvE auto-battler with a self-learning enemy AI — runs entirely in the browser.
- Face Detection — Real-time face detection in the browser via webcam.
- Gait Analysis — Real-time human pose and motion tracking from a webcam feed.